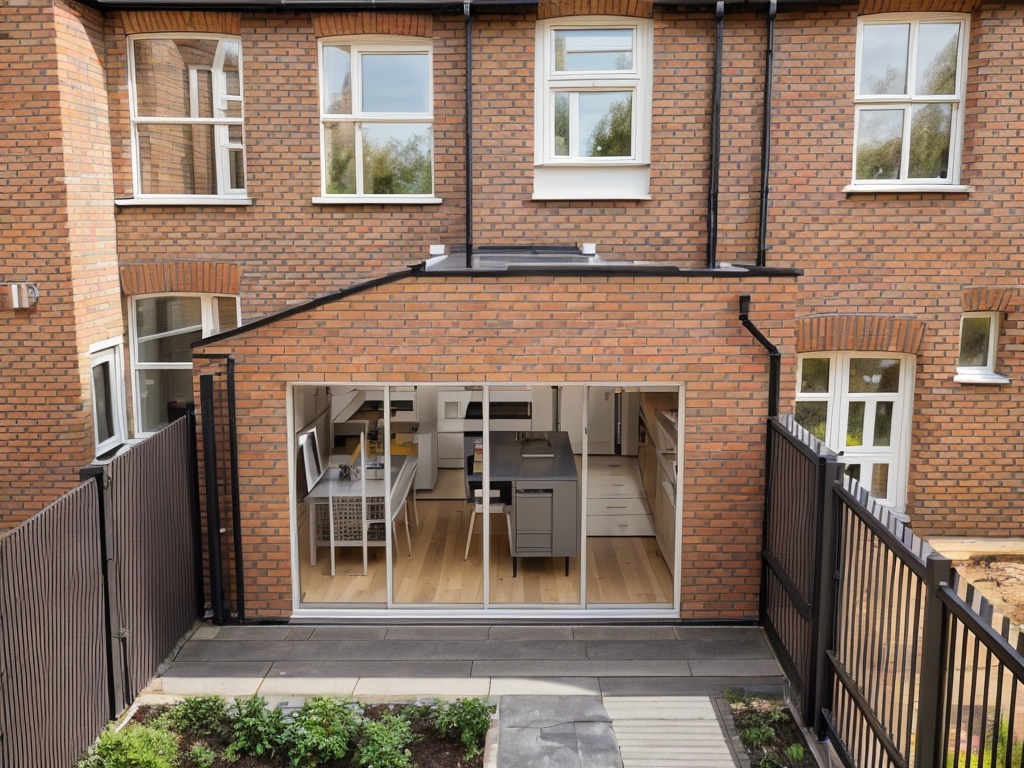
House prices in Newham in 2025
Last year, we saw 1,827 properties sold in the area, with an average house price of £465,912. This represents a decrease of -17.14% in the volume of transactions year on year. Meanwhile the average selling price saw a decrease of -8.61% in the same period. The average value add score for the area is 54.
61047 properties
60a Wyatt Road
£542,569 • Est. today
£438,000 • Jul 2022
+ 2 more
27 Flat 69 Mahindra Way
£340,005 • Est. today
£315,000 • Jul 2022
48 Mcgrath Road
£367,155 • Est. today
£367,500 • Jul 2022


Triathlon Point, 11 Flat 54 Madison Way
£536,023 • Est. today
£487,000 • Jul 2022
Charles Darwin House, 17 29 Minnie Baldock Street
£392,300 • Est. today
£395,000 • Jul 2022
60 White Horse Road
£334,960 • Est. today
£225,000 • Jul 2022
+ 3 more
72 St Pauls Drive
£345,597 • Est. today
£350,000 • Jul 2022
+ 1 more
Jane Austen Hall, 21 Flat 7 Wesley Avenue
£355,207 • Est. today
£355,000 • Jul 2022
+ 1 more
27 Flat 52 Mahindra Way
£421,096 • Est. today
£420,000 • Jul 2022
George Court, 3 51 Shackleton Way
£681,195 • Est. today
£660,000 • Jul 2022
Kelson House, 10 68 Schooner Road
£745,405 • Est. today
£825,000 • Jul 2022
+ 1 more
68 Goldsmith Avenue
£532,204 • Est. today
£530,000 • Jul 2022
14 Chesley Gardens
£533,497 • Est. today
£400,000 • Jul 2022
+ 1 more
51 Jade Close
£632,936 • Est. today
£430,000 • Jul 2022
+ 1 more
79 Lathom Road
£537,657 • Est. today
£400,000 • Jul 2022
+ 1 more
37 Liddon Road
£545,791 • Est. today
£377,500 • Jul 2022
+ 1 more
23 Queens Road West
£602,965 • Est. today
£600,000 • Jul 2022
+ 1 more
43 Upper Road
£575,560 • Est. today
£475,000 • Jul 2022
+ 1 more
135 Prince Regent Lane
£532,204 • Est. today
£530,000 • Jul 2022
50 St Olaves Road
£601,709 • Est. today
£460,000 • Jul 2022
+ 2 more
15 Dunbar Road
£655,042 • Est. today
£650,000 • Jul 2022
+ 1 more
3b St Dunstans Road
£446,804 • Est. today
£238,000 • Jul 2022
107 Woodford Road
£812,290 • Est. today
£830,000 • Jul 2022
+ 4 more
25 Outram Road
£427,983 • Est. today
£320,000 • Jul 2022
+ 3 more
61 Birchdale Road
£528,711 • Est. today
£510,000 • Jul 2022
Where does this data come from?
The property price data for England and Wales that you see on our website is sourced primarily from HM Land Registry's Price Paid Data. This dataset is the one source of truth for most of the country’s residential property transactions. Where available, we’ve enhanced this with information gathered from Energy Performance Certificate (EPC) data and then further added to it with records from various trusted additional sources. This material was last updated on October 7, 2024.
Some of the figures you see above, such as the Value Potential score are constructed using our own proprietary algorithmic modelling. They are most decidedly estimates, and may be off the mark. Please use this information cautiously, and as a guide only. If in doubt, and certainly before putting in an offer anywhere, please speak with your local estate agent to get a better understanding of the property’s valuation.
Number of properties sold
Copyright © 2022 Resi Design Ltd.
Resi Design Ltd. trading as 'Resi' | Company No: 10471125
We are proud to employ architects registered with the Architects Registration Board and were awarded the mark for The Mayor's Good Work Standard for fair pay & conditions, wellbeing, skills, progression, diversity and recruitment.